×
模态框(Modal)标题
在这里添加一些文本
Close
Close
Submit
Cancel
Confirm
×
模态框(Modal)标题
×
Toggle navigation
Home
About Journal
Journal Online
Just Accepted
Current Issue
Archive
Most Read
Most Download
Most Cited
E-mail Alert
Contact Us
中文
Figure/Table detail
Reconstruction and driving mechanism analysis of extreme flood events in Northeast China in 1750-2020
Xiangyu YU, Yuda YANG
J Palaeogeogr
, 2024, 26(
3
): 753-762. DOI:
10.7605/gdlxb.2024.03.029
时段
1750—1870
1871—1960
1961—2020
极端
洪涝
年份
1754 1765
1789 1822
1846 1849
1872 1881 1886 1888 1894 1896 1909 1910 1911 1914 1915 1917 1923 1930 1934 1953 1957 1960
1985 1994
1998 2012
2013
发生频率/%
5.0
20.0
8.3
Table 3
Extreme flood events years in Northeast China in 1750-2020
Other figure/table from this article
Fig.1
Location of Northeast China and studied sites
Table 1
Classification of flood in Northeast China in 1750-1949
Table 2
Identification criteria of extreme floods events in Northeast China in 1750-2020
Fig.2
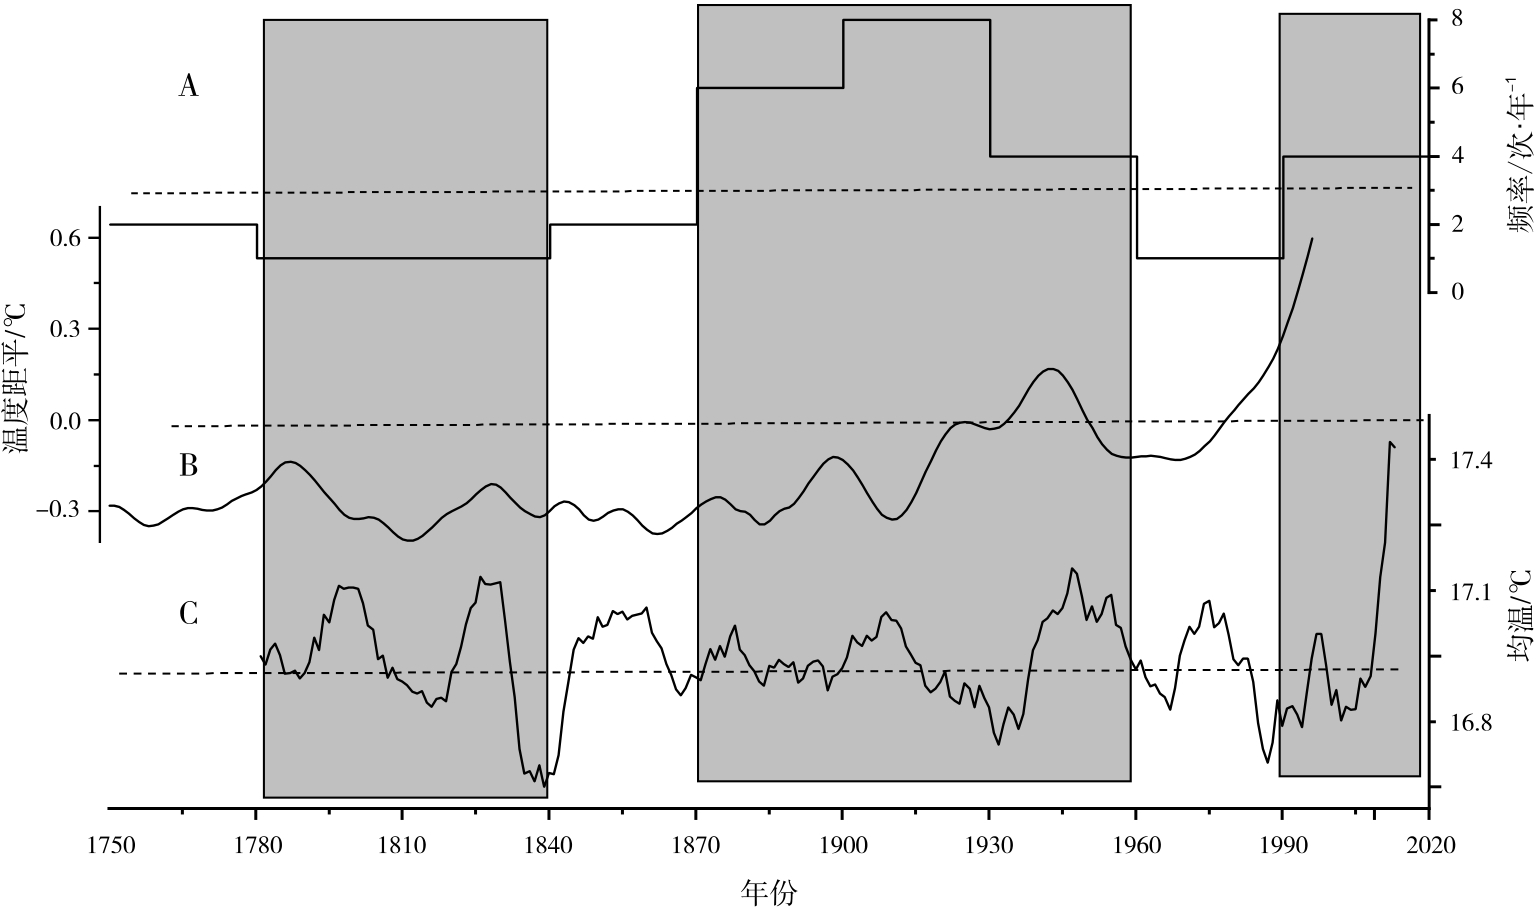
Extreme floods events and temperature changes in Northeast China in 1750-2020
Fig.3
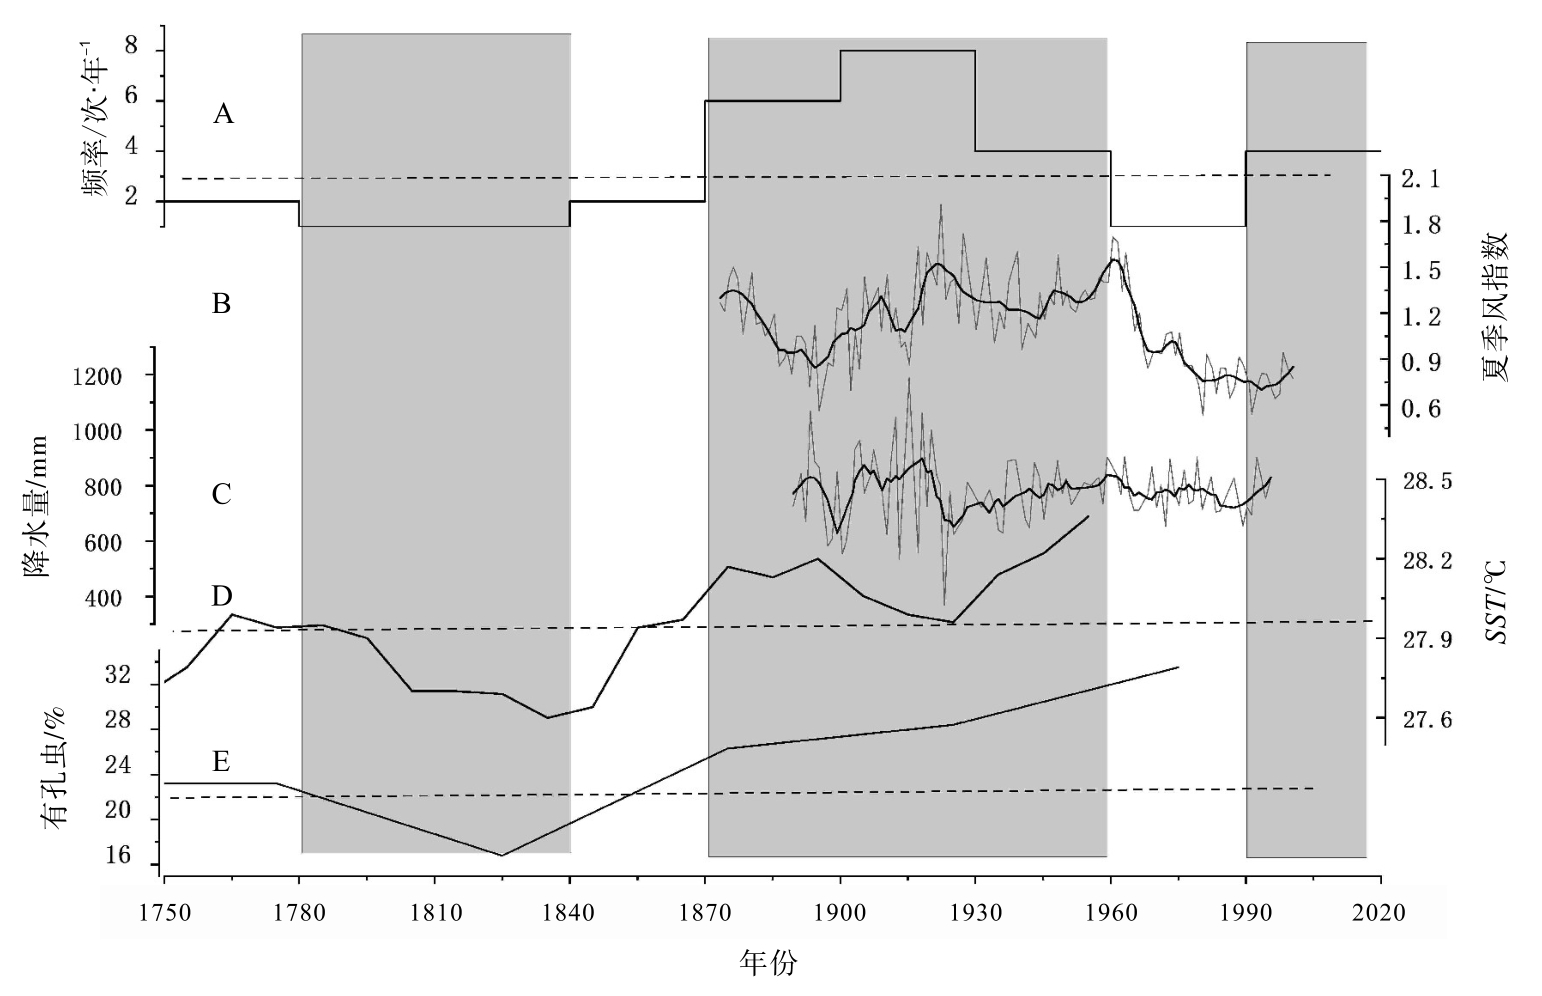
Comparison of extreme flooding events in Northeast China with summer monsoon and sea surface temperature changes in 1975-2020
Table 4
Statistics of extreme floods events in El Niño, La Niña and normal years of Northeast China in 1975-2020