×
模态框(Modal)标题
在这里添加一些文本
Close
Close
Submit
Cancel
Confirm
×
模态框(Modal)标题
×
Toggle navigation
Home
About Journal
Journal Online
Just Accepted
Current Issue
Archive
Most Read
Most Download
Most Cited
E-mail Alert
Contact Us
中文
Figure/Table detail
Sodium Storage Performance of Mixed-phase Sodium Titanate Tuned by Carbon Dots
LI Dan, HU Honghui, HOU Hongshuai, ZHANG Sheng, LIU Lijie, JING Mingjun, WU Tianjing
Chem J Chin Univ
, 2025, 46(
06
): 95-106. DOI:
10.7503/cjcu20240356
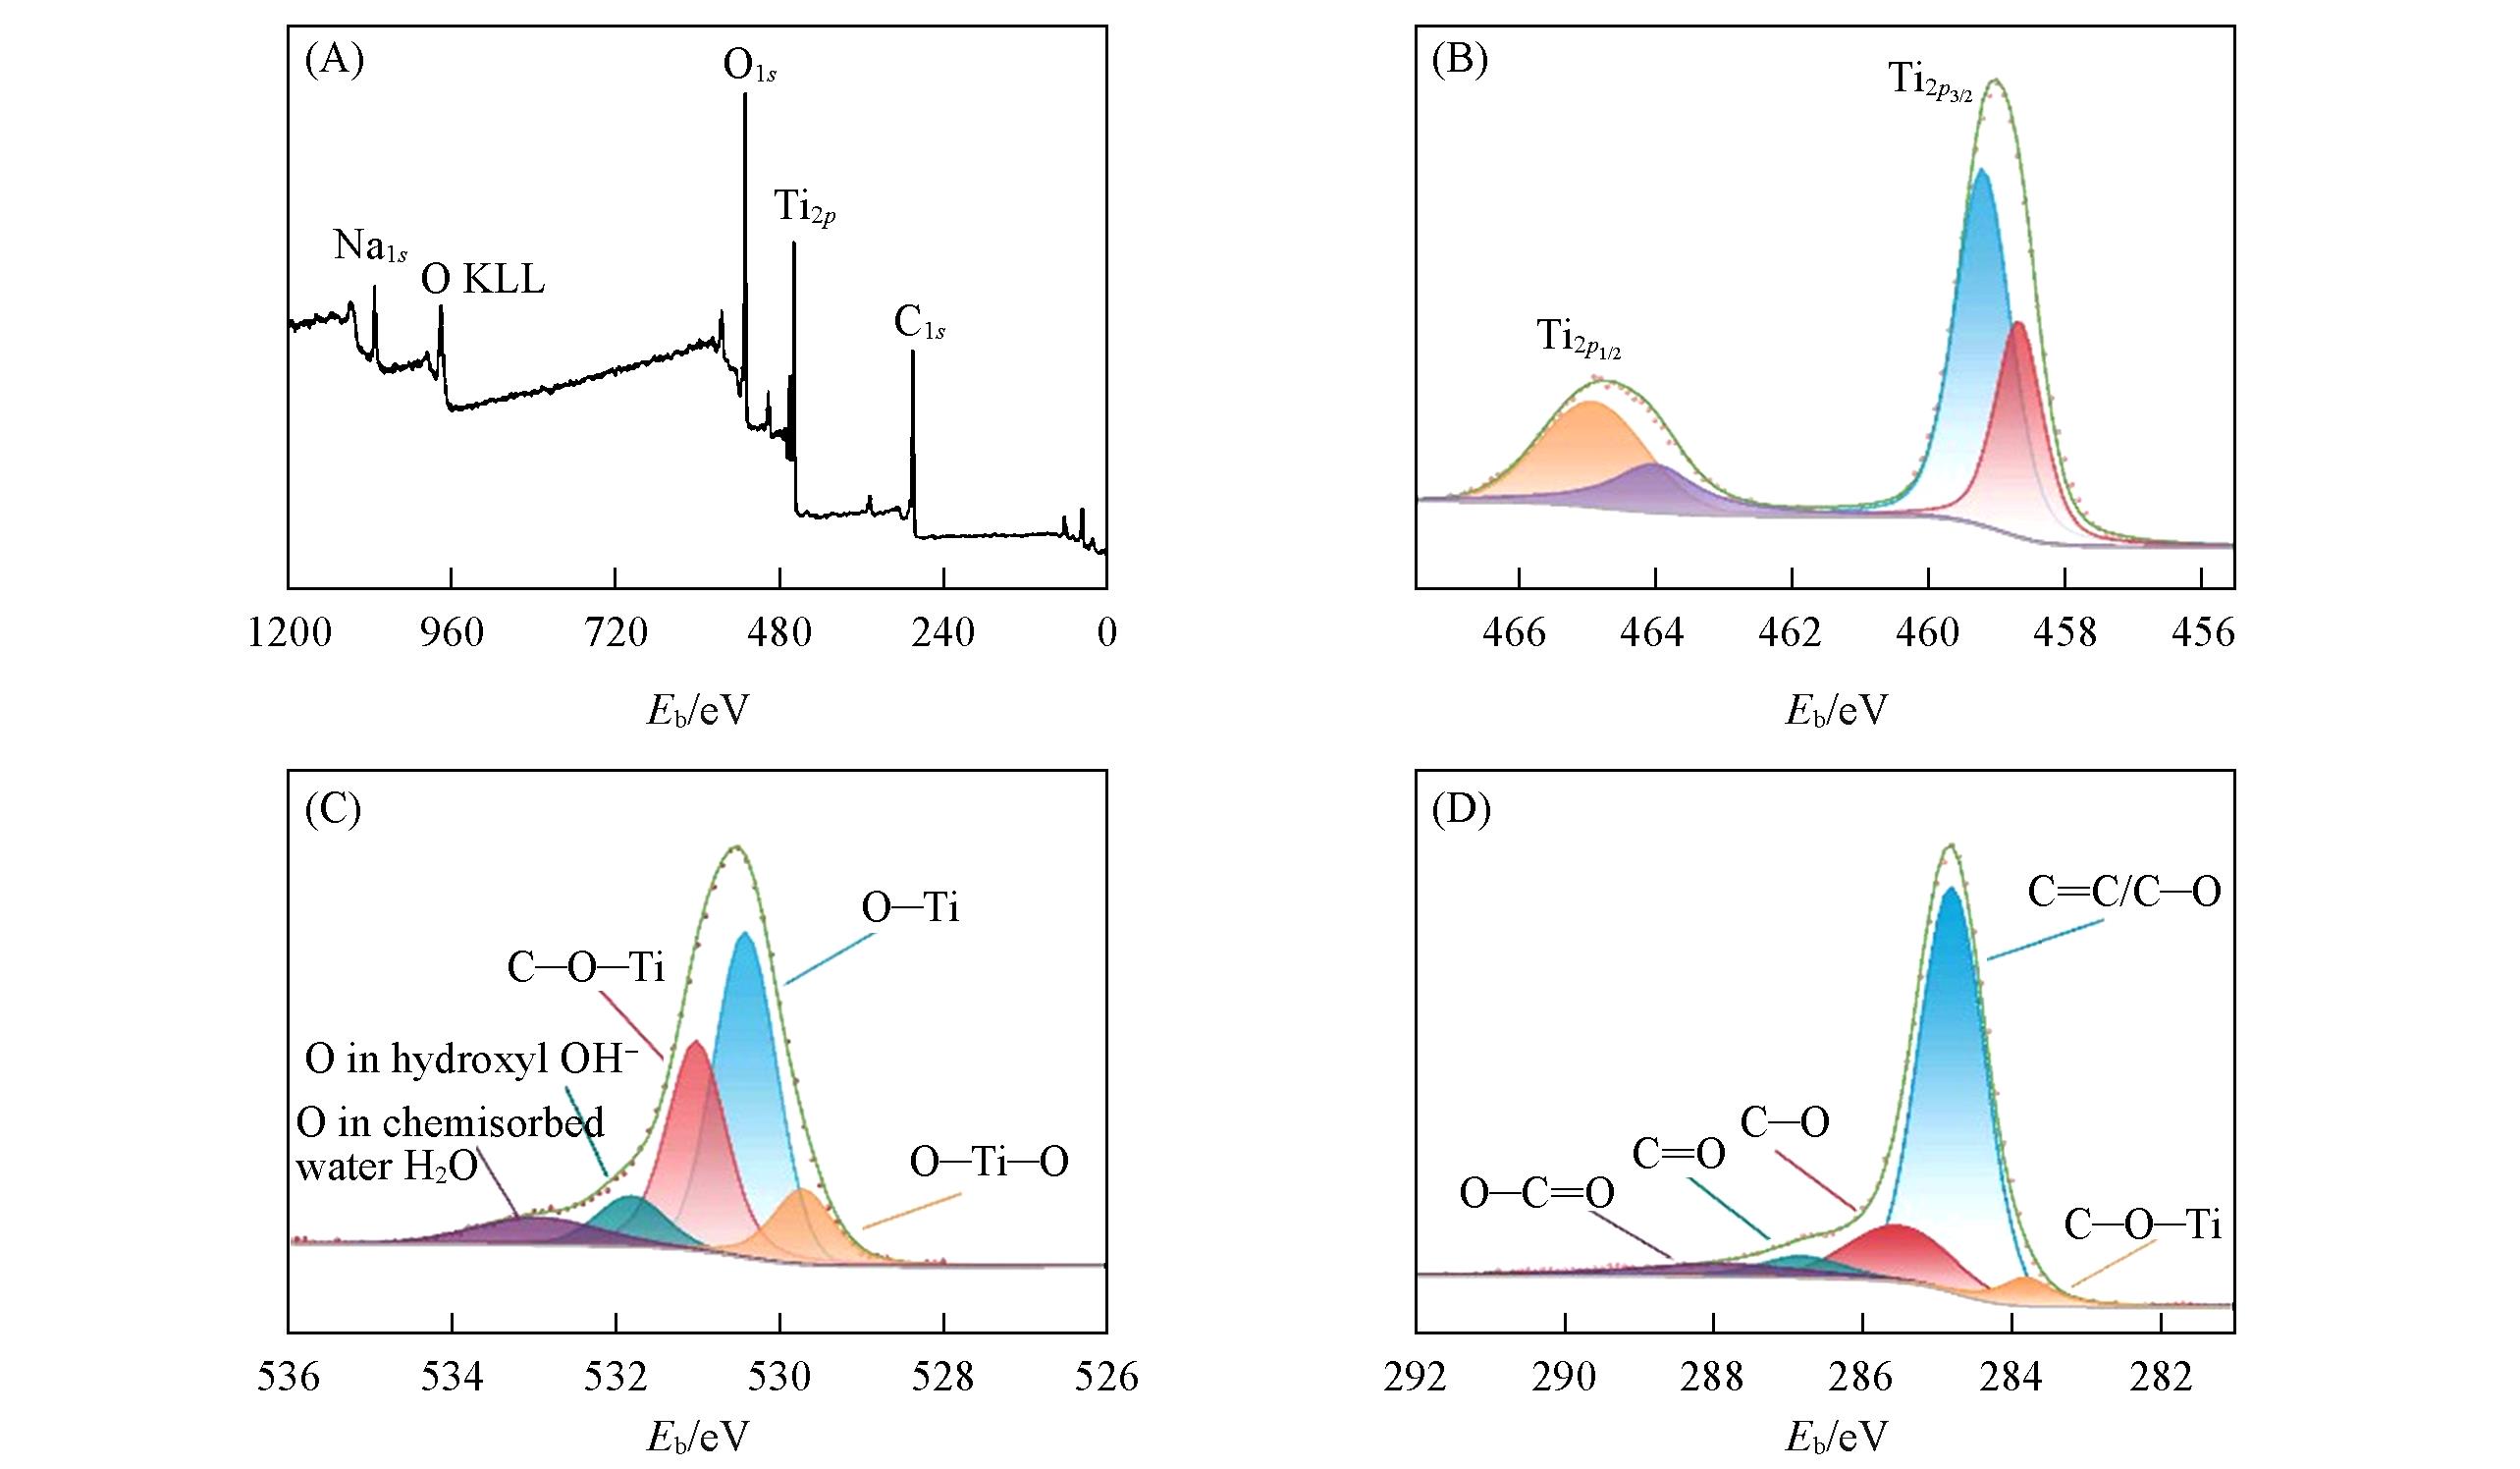
Fig.4
XPS survey(A) and high resolution spectra for Ti
2
p
(B), O
1
s
(C) and C
1
s
(D) of NNTO/C
Other figure/table from this article
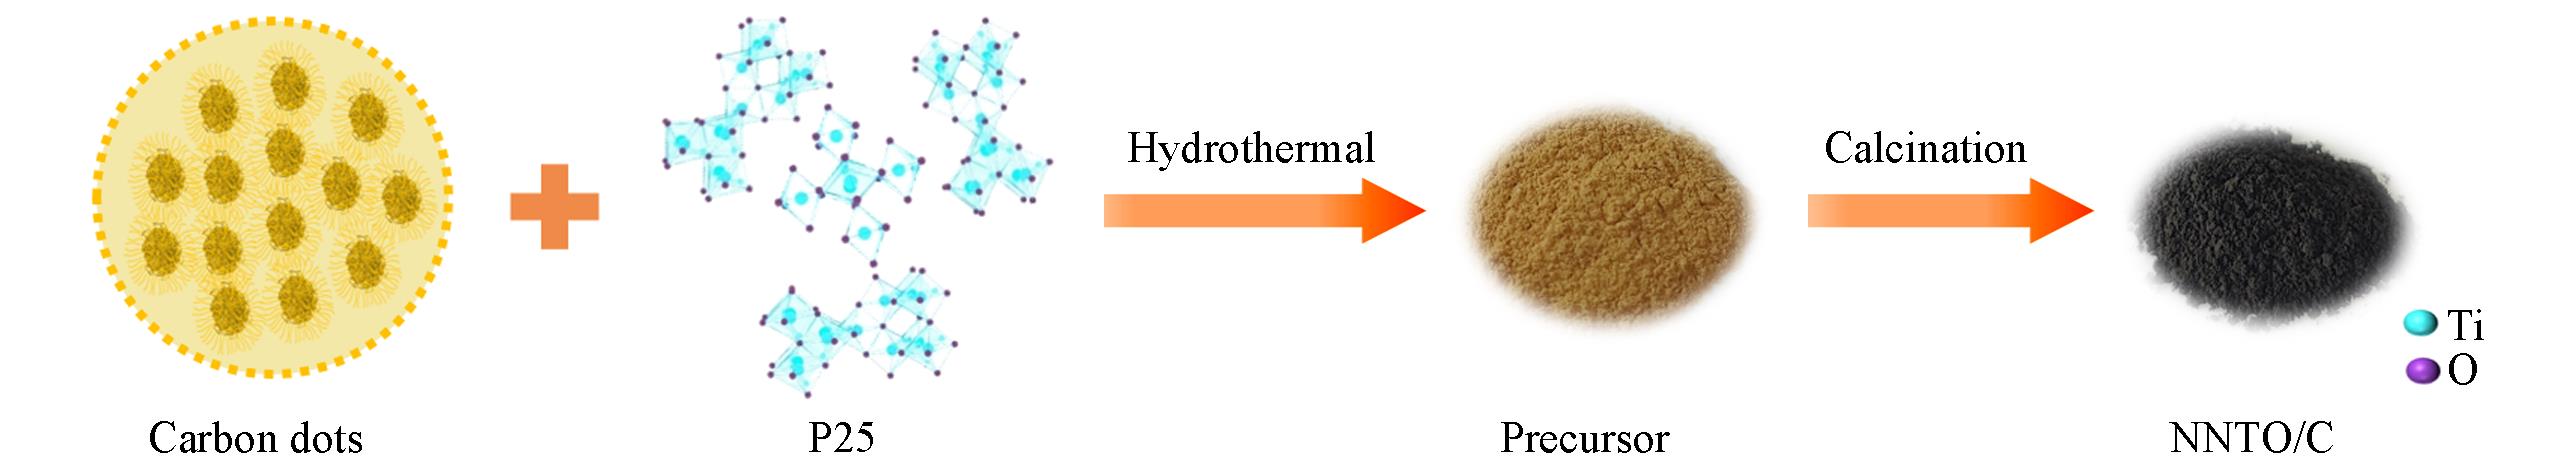
Scheme 1
Schematic diagram of NNTO/C preparation process
Fig.1
SEM images of NNTO(A) and NNTO/C(B), TEM(C) and HRTEM images(D) of NNTO/C
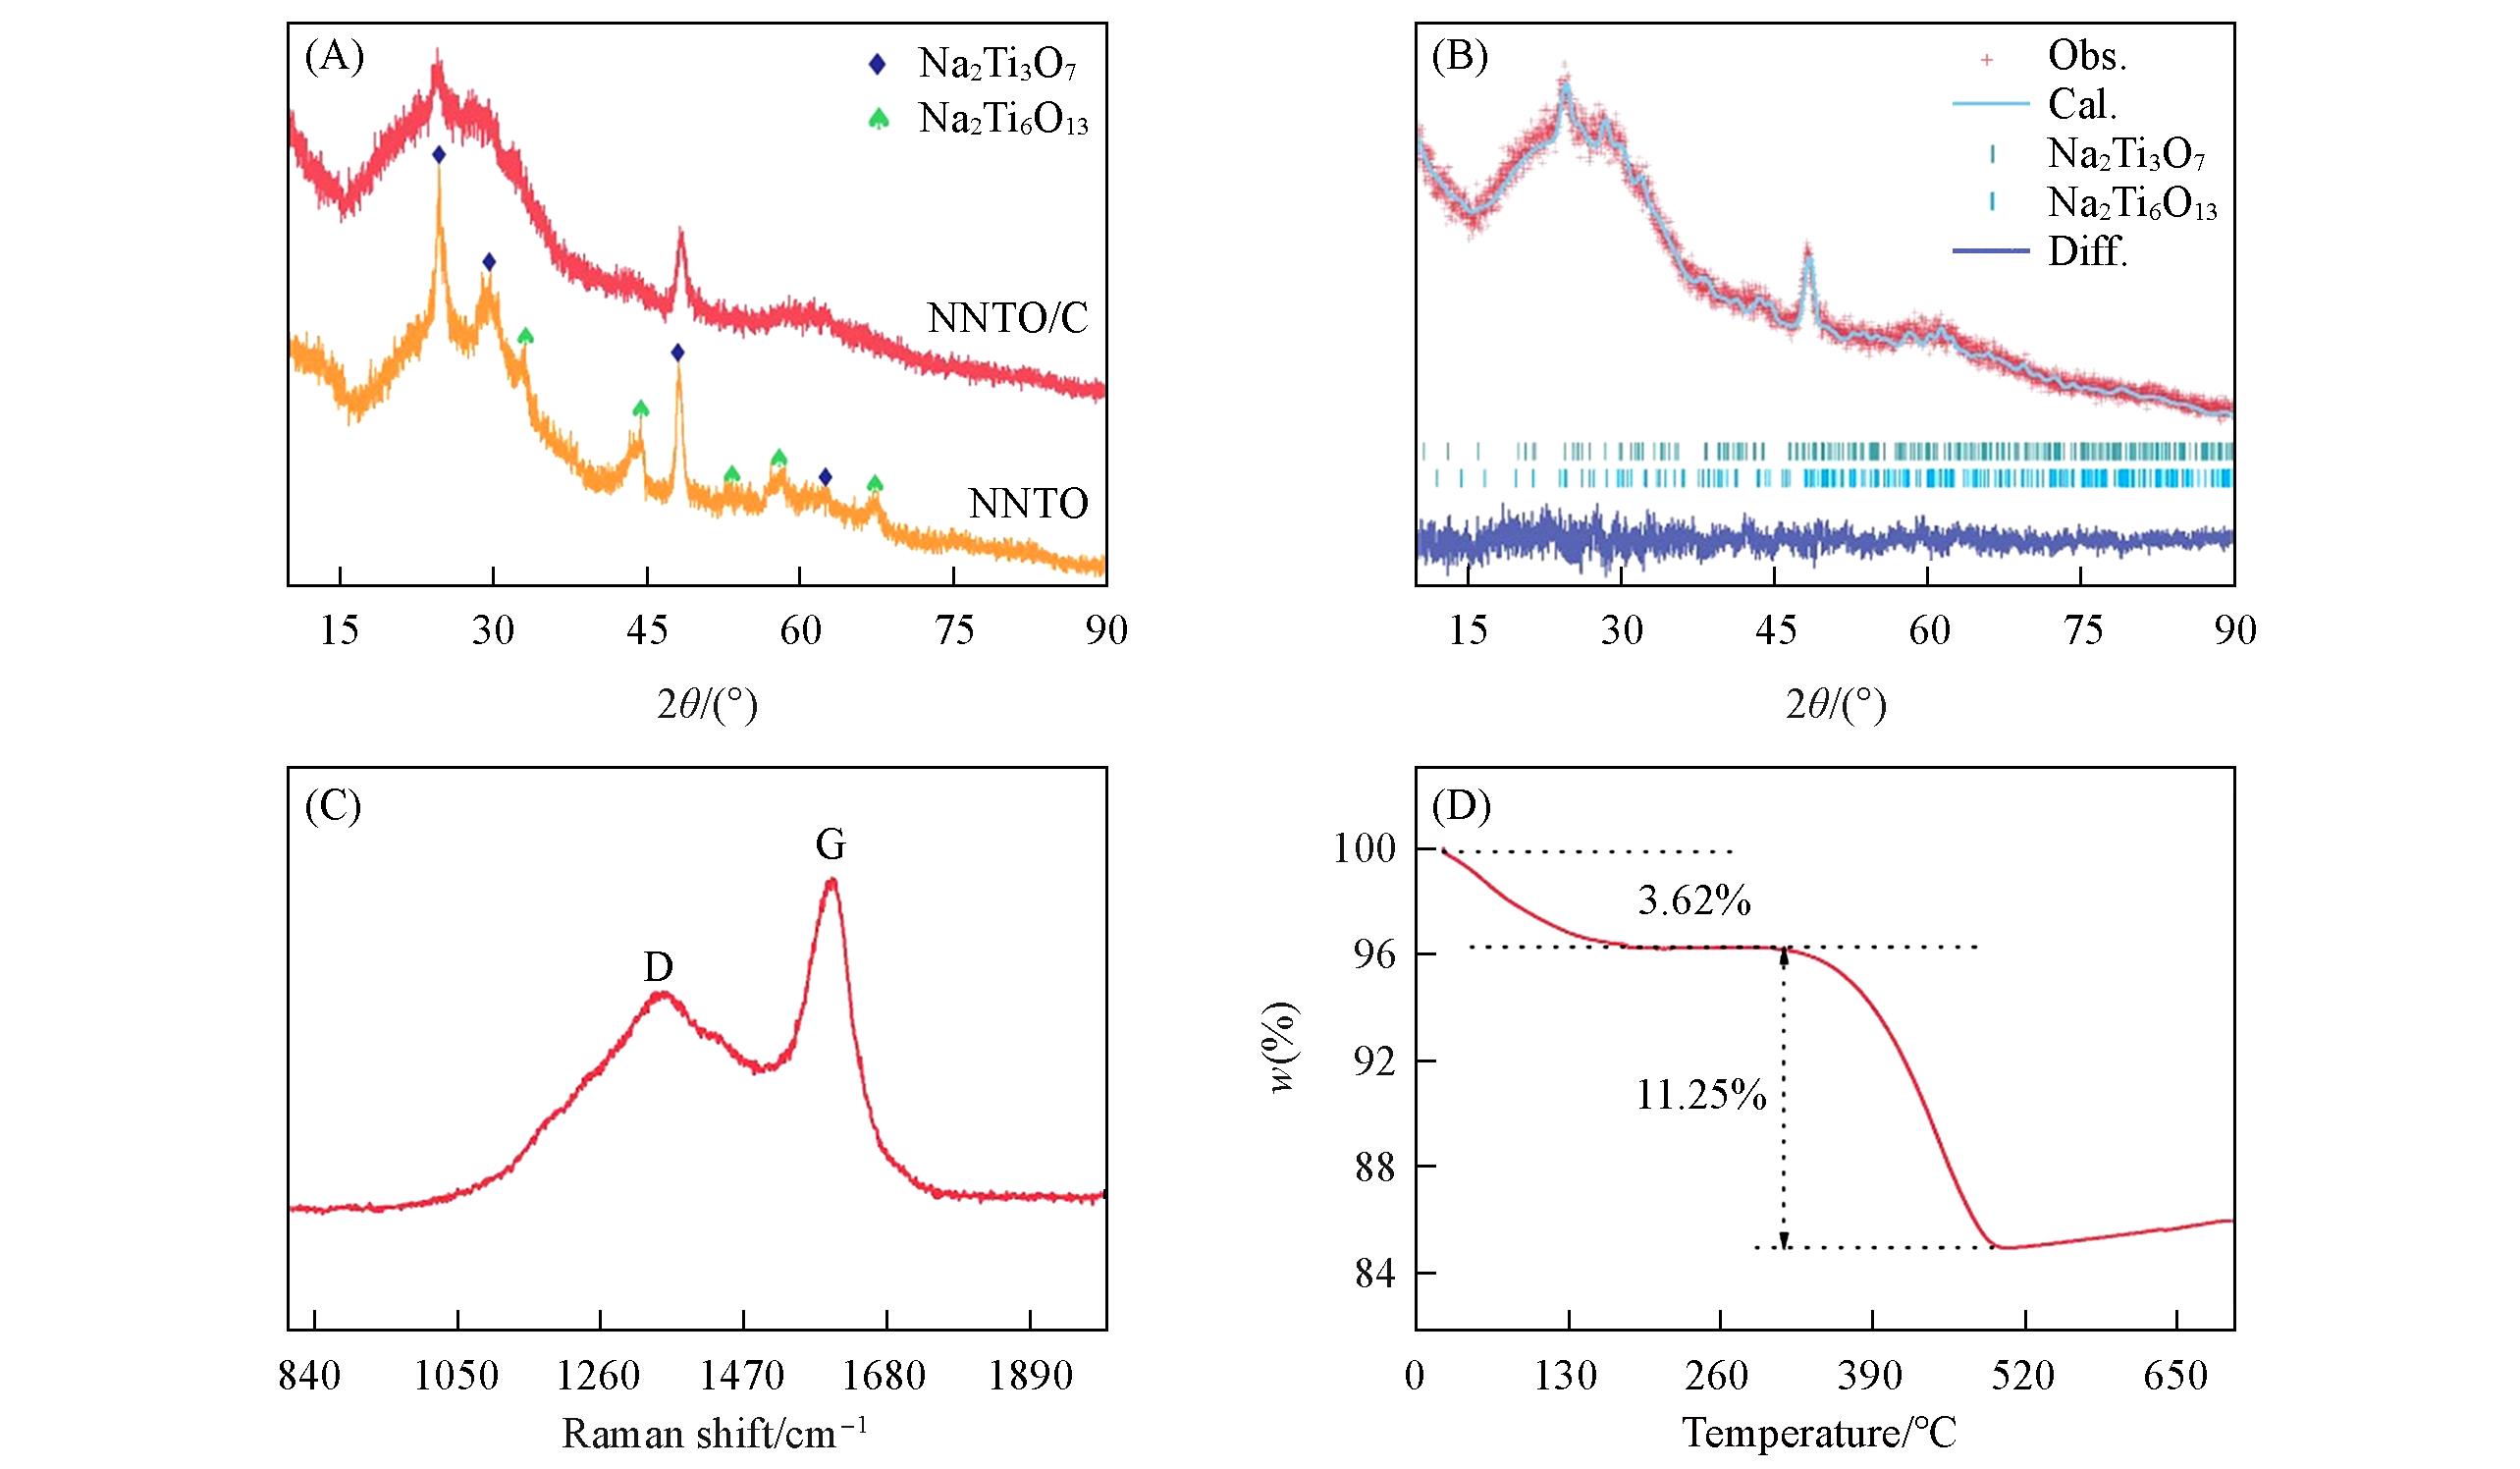
Fig.2
XRD patterns of NNTO and NNTO/C composites(A), Rietveld refinement(B), Raman analysis(C) and TGA profiles(D) of NNTO/C sample
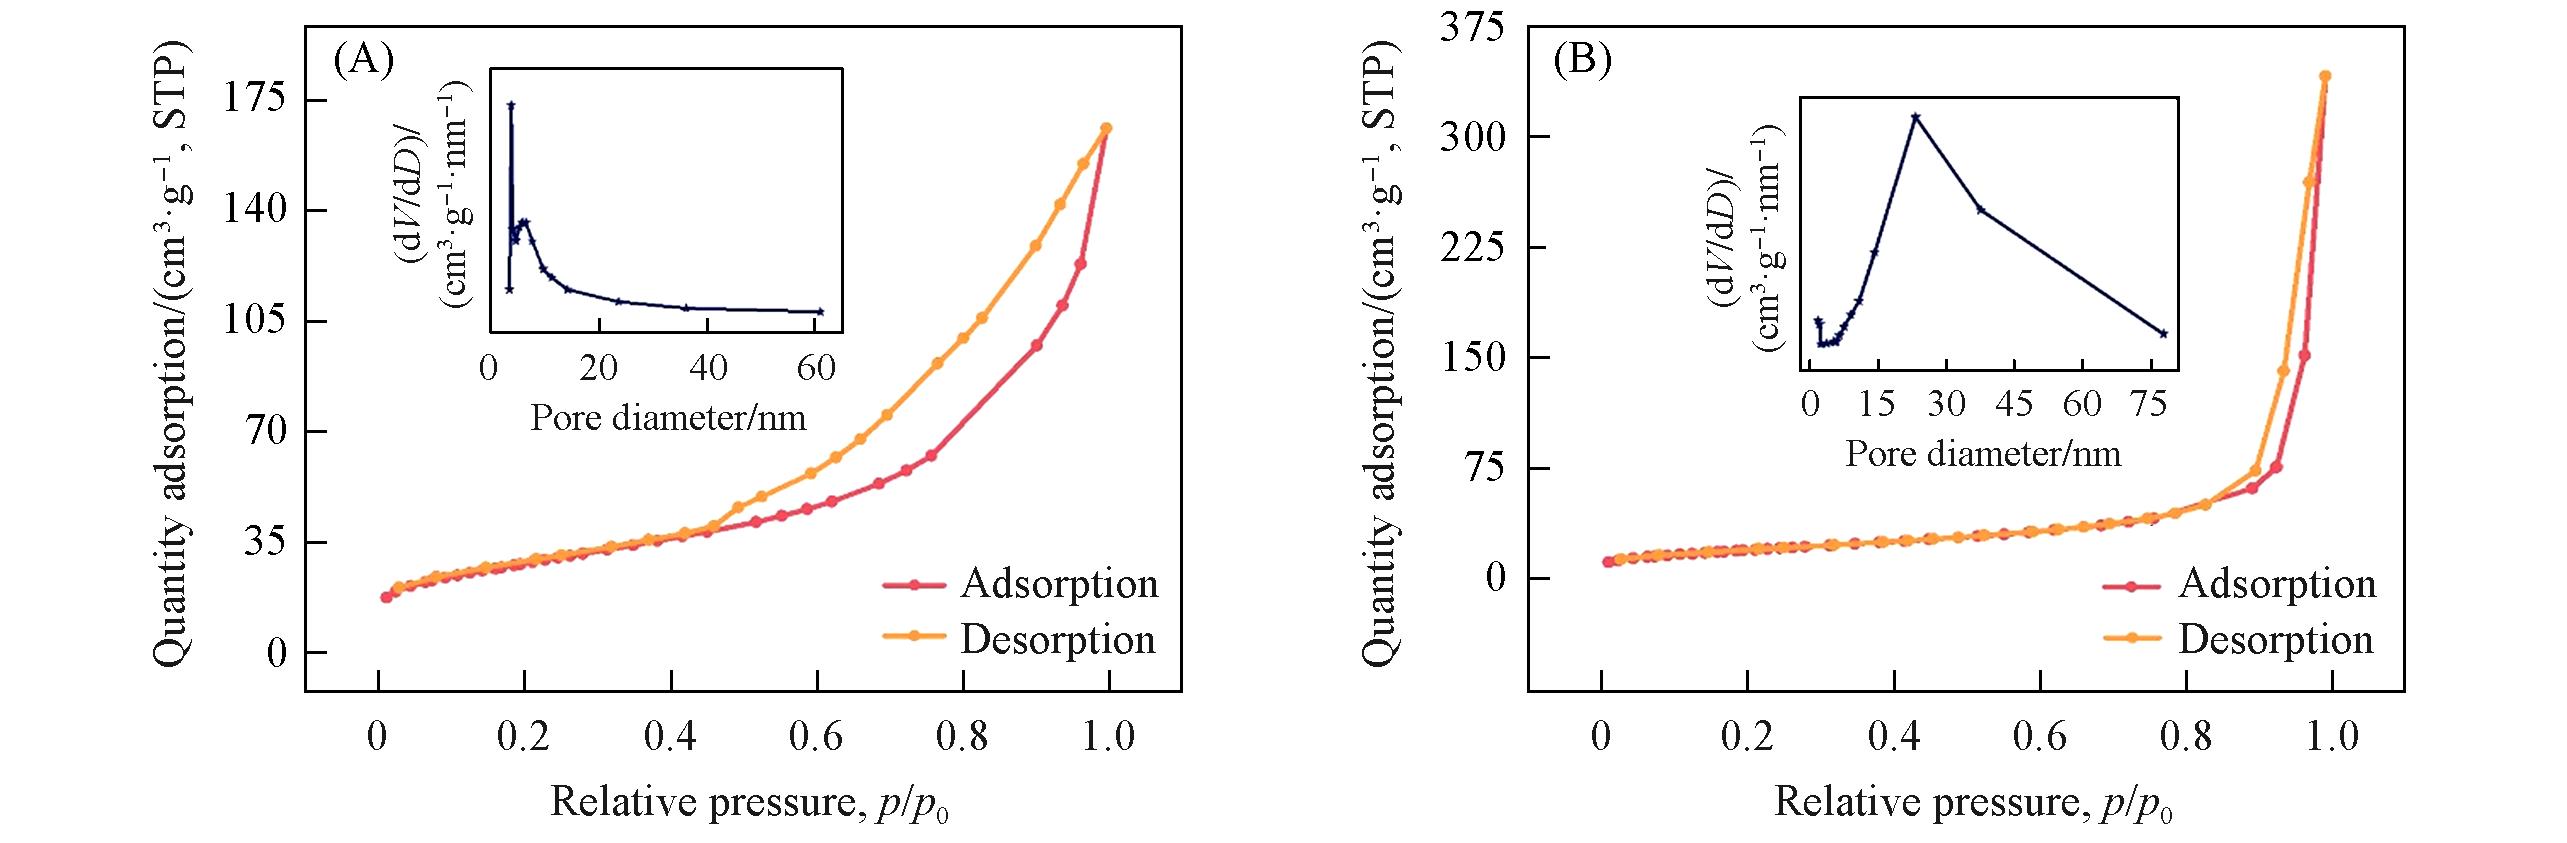
Fig.3
N
2
adsorption⁃desorption isotherms and pore size distributions(insets) of NNTO/C(A) and NNTO(B)
Fig.5
CV plots of NNTO/C at 0.1 mV/s(A), cycling performances of NNTO/C and NNTO at 0.05 A/g(B), rate capabilities of NNTO/C and NNTO(C), charge⁃discharge curves of NNTO/C(D), cycling properties of NNTO/C at 1.00 A/g(E)
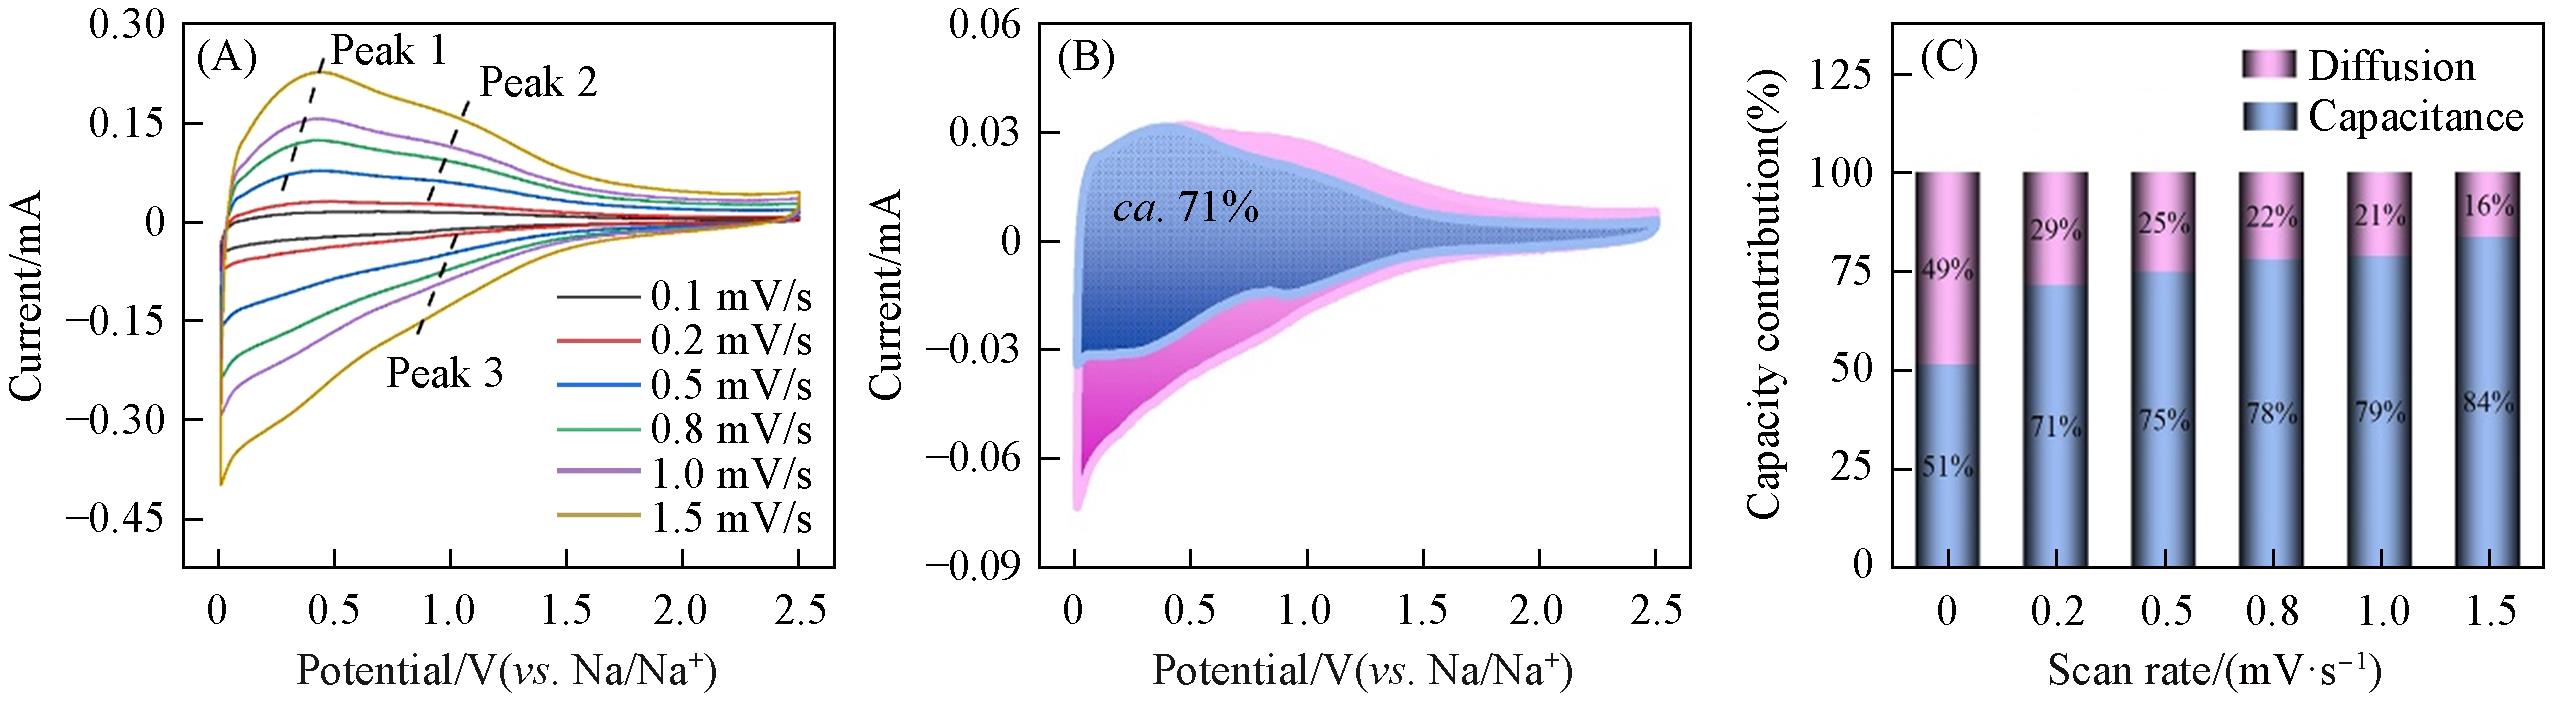
Fig.6
CV plots at various sweep speeds(A), capacitive and diffusive contributions at 0.2 mV/s(B), diffusion and pseudo⁃capacitive contributions at various scan rates of NNTO/C(C)
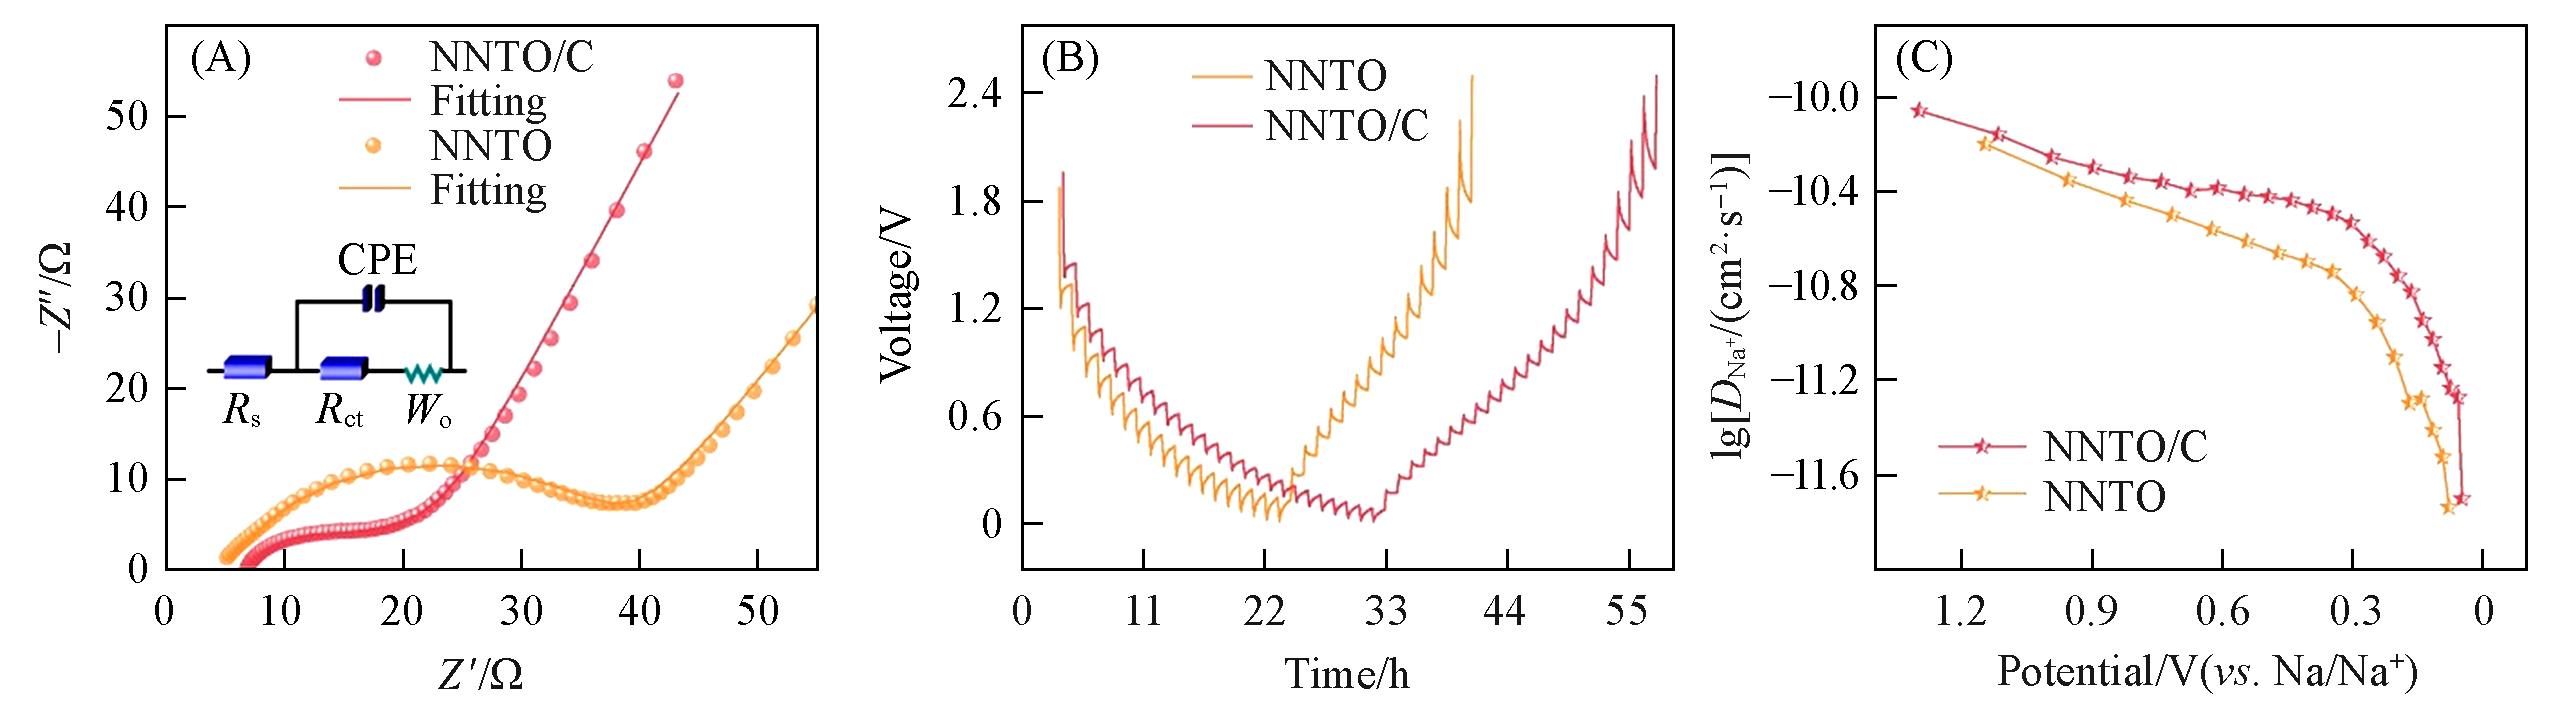
Fig.7
Nyquist plots(A), GITT profiles(B) and Na
+
diffusion coefficient(C) of NNTO/C and NNTO